

There’s a story behind every statistic.
A weekly newsletter using data to navigate our messy, uncertain world
New here? Start with these.
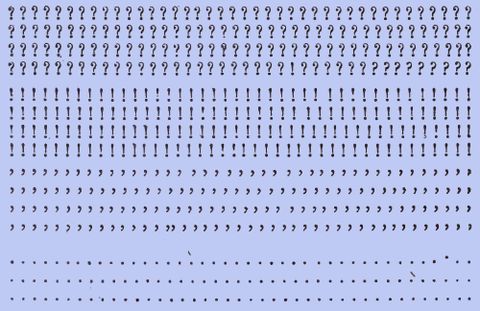
Understanding large values: It's our ethical duty

Can you see three trees?
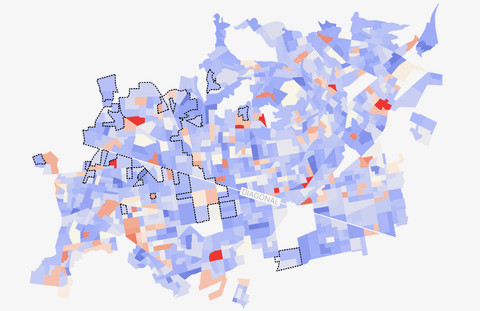
Looking for the rich? Check in the shadows.
Recent issues

One year of Not-Ship: Finding clarity in uncertain times
47 issues, 167 charts and a few lessons about our messy world....

How Amazon pushes up prices all across the Internet
You don’t have to shop on Amazon to pay Amazon's high prices....

What's good for Amazon is good for ... Amazon
How the world's largest company makes you pay more for less....
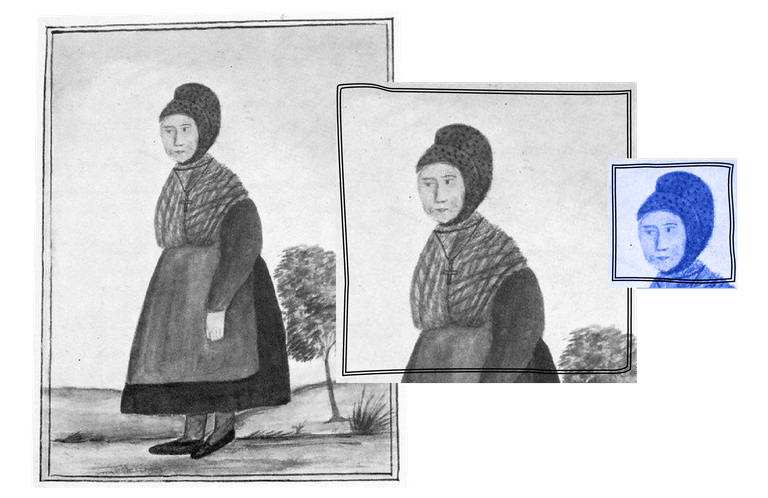
Do we actually know how to make cities safer for women?
Women-only buses, catcalling fines and gender-sensitive design — we've tried them all....
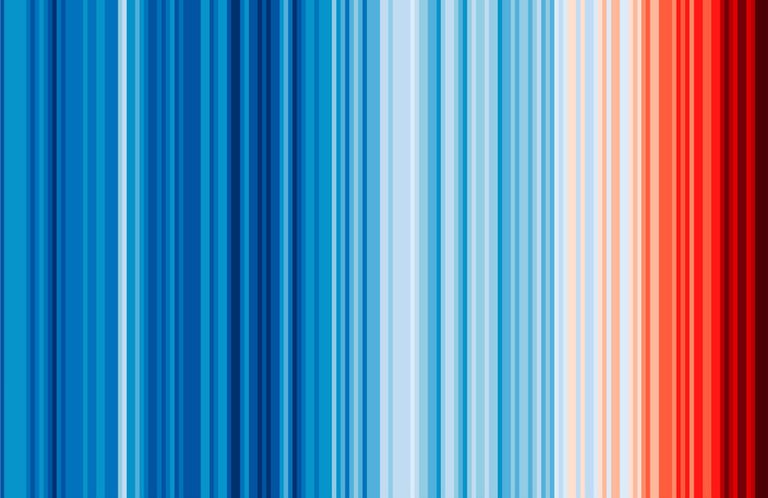
No axes, no labels, no numbers: How this chart became a climate change icon
A data visualization designed to start conversations, not report numbers...
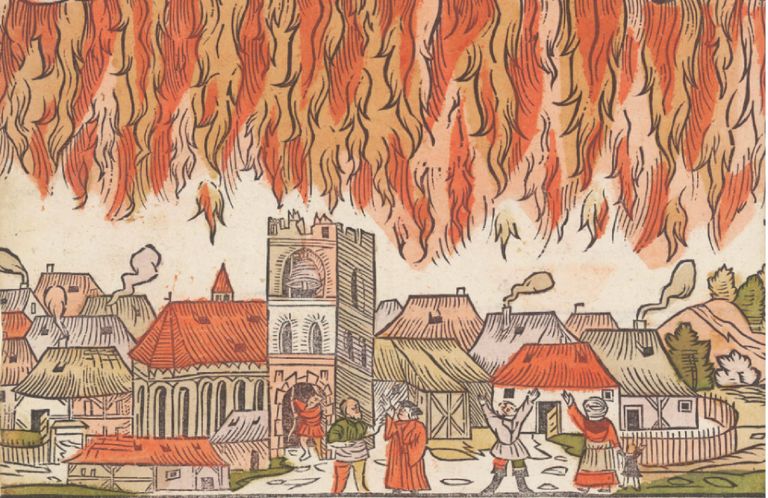
Stop trusting the extinction math
The AI industry's favourite 'statistic' isn't backed by data. And it distracts from what's really going on....
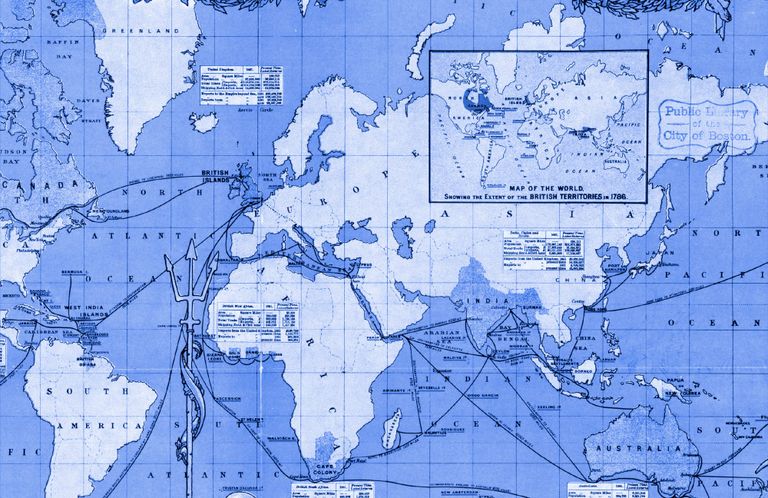
The UN challenges five centuries of cartography
Have you heard? There's map news!...
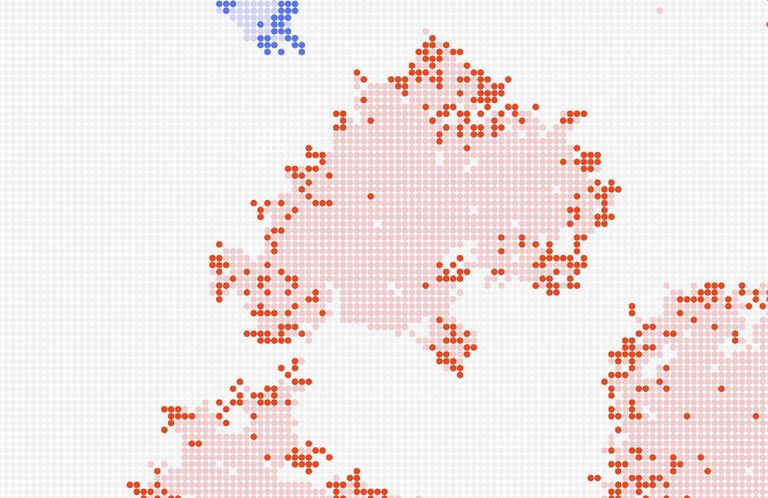
Let's normalize debunking each other
The spread of misinformation has become an epidemic, but information hygiene can help....
The next chart is in the works…
Get Not-Ship in your inbox every week.