This edition of Not-Ship is a little bit different. Last week, I spent three days at a nerdy conference — and now I'm sharing the best bits with you! It's also our first paywalled post. To read the whole thing, become a paid subscriber for $9/month or $90/year. (And thank you to the 31 people who joined during our birthday subscriber drive!)
If you're not able to pay right now, I hope you'll still stick around. A few posts each month will be free for everyone to read.
💙 Amanda
This summer, at a music festival in the Netherlands, researchers asked people to swallow a pill. No, not that kind. It was a tiny thermometer that tracked their core temperature as they danced.
That was one of the stories I heard last week at the Visualising Climate conference, a gathering about one of the greatest communication challenges humanity faces: Climate change. How do you make it matter when the scale is unfathomable, the timeline is long and the data are complex? The people I met have been thinking really hard about this.
I learned a lot about how to tell better climate stories. But ultimately, the lessons go well beyond climate science and charts. They're useful for anyone trying to get people to care about something complicated.
Collaborating is painful. Do it anyway.
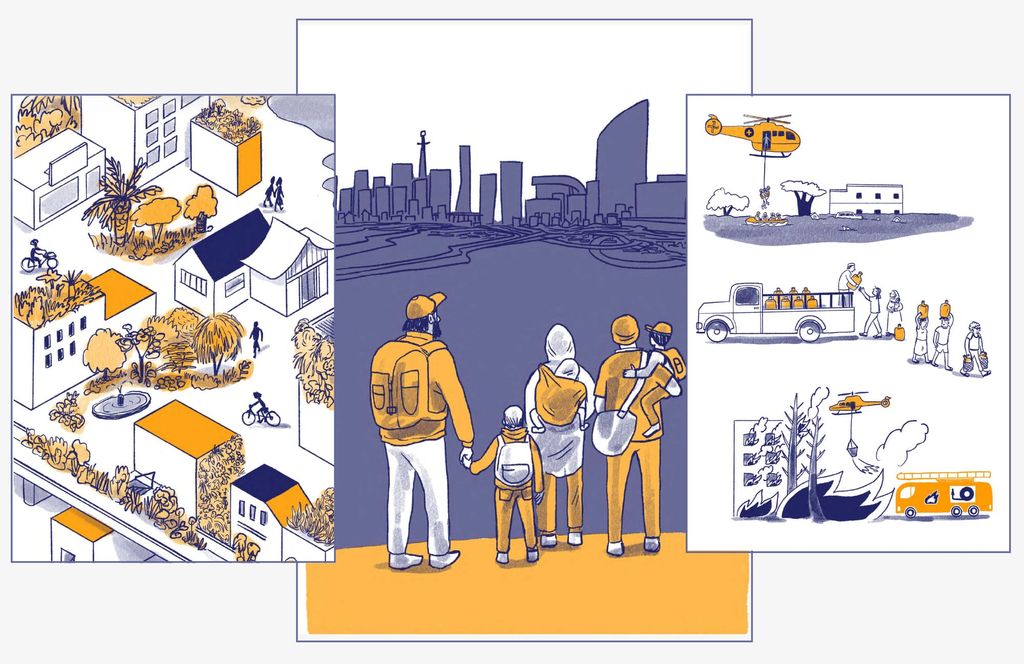
Angela Morelli may be a saint. As CEO of InfoDesignLab, she co-led the team that created graphics for part of the IPCC’s Sixth Assessment Report, the UN's landmark summary of climate science. Her miracle? Working through more than 1,300 pieces of feedback from scientists and researchers during the process.
During her talk, she visualized how that felt: