
Welcome to Not-Ship; the first dispatch! You can read it for free, but please share widely if you like it. If you love it: help keep it afloat. Each week, I want this to be something you can't wait to read. So, let me know what you think.
💙 Amanda
The world is a lot right now. I don't know about you, but it all feels so uncertain.
Oh wait — I do know about you. Statistically, that is.
This is the global uncertainty index. It measures the number of times the word "uncertainty" appears in particular reports. Look at that jump! It's giving Al Gore on a scissor lift.
It's clear I'm not alone.
Global uncertainty index, Jan. 2008 to Aug. 2025
Whether you're in Canada, Japan, the UK or the US, uncertainty is on the rise.
In many of the world's richest countries, we're seeing the second-highest or highest spikes in decades.
Uncertainty index for the ten wealthiest countries
It's pretty clear that we're all feeling it. But why?
Not-Ship helps you make sense of our messy, uncertain world.
Once a week. Right to your inbox.
We live in a world that is getting increasingly complex. Climate change, runaway capitalism, artificial intelligence and geopolitical instability are colliding in absurd, and often harmful, ways.
Some call it a polycrisis—a network of interconnected crises that impact and amplify one another. To see what I mean, think about our attempts to reduce global emissions. Even as a positive initiative, it has knock-on effects that touch migration, technological innovation and unemployment in complicated ways.
How the net-zero transition fits in the polycrisis
Arrows indicate causal (+) and inverse (-) relationships within the system
Amidst this complexity, we have access to more information, and disinformation, than ever before. It's hard to know who to trust.
What's more, we're confronted with constant contradictions. Scientists issue increasingly dire warnings about global heating, while politicians continue to allow for new oil and gas exploration. AI companies insist we need to carefully oversee the technology, but then actively fight regulations. US politicians say "every vote counts", while they manipulate the boundaries of voting districts in their favor. What we see, and experience, doesn't always match with what we're told.
Snowballing complexity, information overload and nonstop contradictions: It's a recipe for overwhelm and helplessness.
This is why I started Not-Ship. I don't have many answers, but I do have data. Data about banks backtracking on climate promises, about the AI harms no one is counting, about modern preppers, political extremes and digital liter.
That's what I'm using to combat the uncertainty.
By looking at the data ourselves, we can counter confusing narratives and reveal the reality behind the rhetoric. And when that data is visualized — through charts, graphs and diagrams — we find the perfect tool for navigating complexity and information overload.
I think there is power, and sometimes even comfort, in that.
FROM ELSEWHERE
Here's what I found interesting, important or delightful this week:
Three decades ago, they predicted today's political upheaval. In this still-relevant 2020 piece, the academics wrote about realizing their model had become reality.
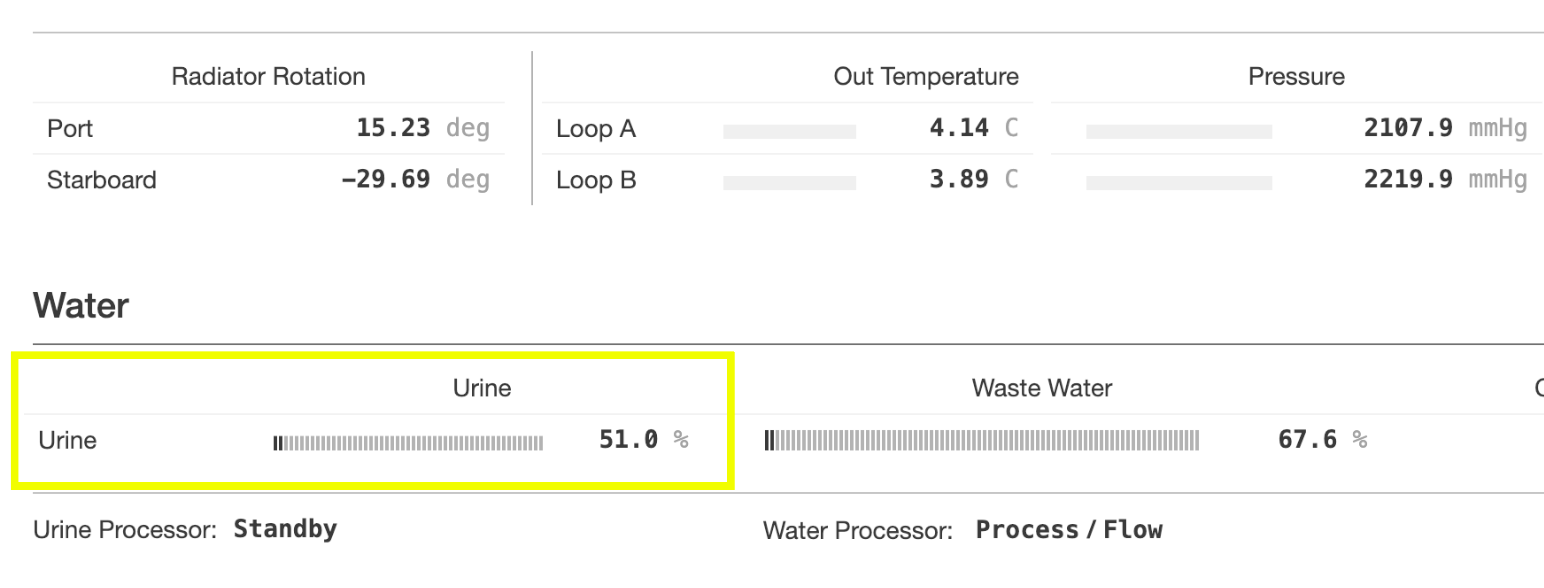
A wee bit of data. NASA reports real-time metrics on the International Space Station, which includes... onboard urine levels. You're thinking: this needs a bot. Already done.
"If I could just request that you refrain from killing each other." Gamers staged a production of Hamlet inside Grand Theft Auto 5.
Nature's most efficient land animal? It's you on a bike. For the magazine's 180th birthday, Scientific American updated a famous graphic from 1973 that explains why.
MORE NOT-SHIP

Member discussion